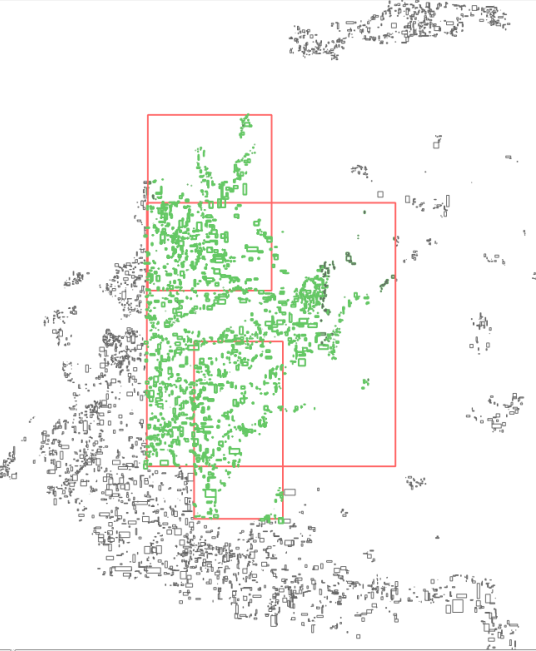
This section presents the preliminary experimental results for the floating buffer tree. For testing purposes a dataset of 23,000 MBRs from a road map of Greece was used (see Figure 6). The original dataset was thinned to produce various subsets ranging in size from 91 objects to 23,000. Most of the testing conducted to this point has been carried out on the smaller datasets (91 to 5000 rectangles). The testing environment and ran the same batches of queries on each of the standard R-Tree, the buffered R-Tree, and the Floating Buffer R-Tree.
Disclaimer:At the time these results were generated the implementations of the three techniques had not been extensively tested, in particular I/O counting routines, and as such these results a very much preliminary.
|
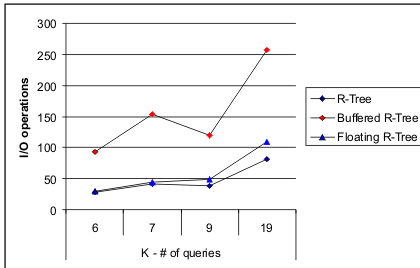
In Figure 7 the results for the three methods are shown in the case where the number of queries, K is varied from 6 to 19. Memory and blocksize were kept constant. As expected the number of I/Os increase with each method as the number of queries increased. The Floating Buffer technique in this case outperforms the Buffered R-Tree technique for all query sets while, surprisingly, the standard R-Tree outperforms both. Another anomoly is that the I/Os required by each method for K = 9 either decreases (Buffered R-Tree and standard R-Tree) or stays relatively stable from K = 7, this is likely due to the manner in which the query sets were generated which was to select a small subset from the actual input file. The various sets were not subsets of each other and as such a larger query set may actually report fewer leaves.
|
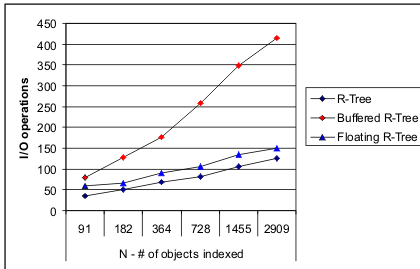
In Figure 8 results are shown where K is kept constant but N is varied. Once again the general trend of the Floating Buffer R-Tree and the standard R-Tree outperform the Buffered R-Tree. The difference between the Floating Buffer R-Tree and standard R-Tree is more or less constant and a more detailed break down of the I/Os involved (not shown) revealed that the additional I/Os incurred by the Floating Buffer technique were due to buffer reads/writes and that the number of I/Os involving reading nodes was identical between the two techniques. This suggests that query paths for the query sets tested either, (1) do not overlap, (2) require limited memory to report, or (3) a potential bug in the I/O counting code. This trend needs to be explored further.
|