We conclude by giving some examples of Voronoi Diagrams applications.
We now figure another algorithm to draw Voronoi Diagrams. Imagine that you grow circles around the points you are using to generate your Voronoi Diagram. Imagine also that you grow them simultaneously and at the same speed. Then, the first time a pair of circles intersect, both circles have the same radius, meaning that the touching point is equidistant from both sites. Suppose now that you stop growing in a given direction each time you touch another circle. This means that once you are done growing you circles, what remains are the touching points, which are all equidistant from some pair of generating points. In other words, they lie on some bisectrix, and careful attention leads to conclude that what you have is actually a Voronoi Diagram.
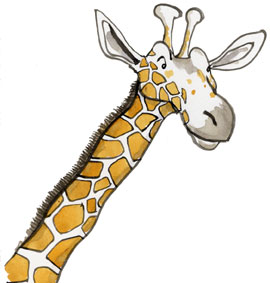
It appears that some natural phenomenon can be modelled by growing circles. One of those phenomenons would apparently be the patches on a giraffe. Although we do not have a serious reference about that (which does not imply that no one exists), if you look carefully at the patches of a giraffe, you may find that those look pretty much like a Voronoi Diagram. Also (once again, we do not have any confirmation from a biologist), apparently that those patches first appear as spots, and slowly grow until they touch. Anyway, whether they really behave as Voronoi Diagrams or not, it is certain that they look enough like Voronoi Diagrams to use it in computer graphics to draw giraffes...
Another phenomenon that can be modelled using Voronoi Diagrams is Soap Bubbles. When you have many soap bubbles stuck together, their boundaries follow some physical equilibrium laws (that we honestly don't really know about) which solution is a 3D Voronoi Diagram.
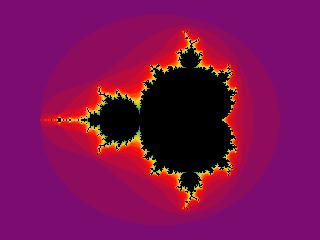
Fractals have been really popular those last year because of their fascinating and always renewed complexity. The most popular fractal object is probably the Mandelbrot set (see Figure 9), but there are also many others. Roughly, although this is far from the actual mathematical definition, a fractal image is nothing more than a portion of the plot of some function sophisticated enough to be visually appealing. Since there are infinitely many functions, several ways have been imagined to help fractal artists to find a good looking one. One of those is through the use of genetic computing. Basically, the idea is to imagine some crossover definition between functions used to generate fractals, and to hope that good looking fractals parents will engender good (and hopefully better) looking fractal sons.
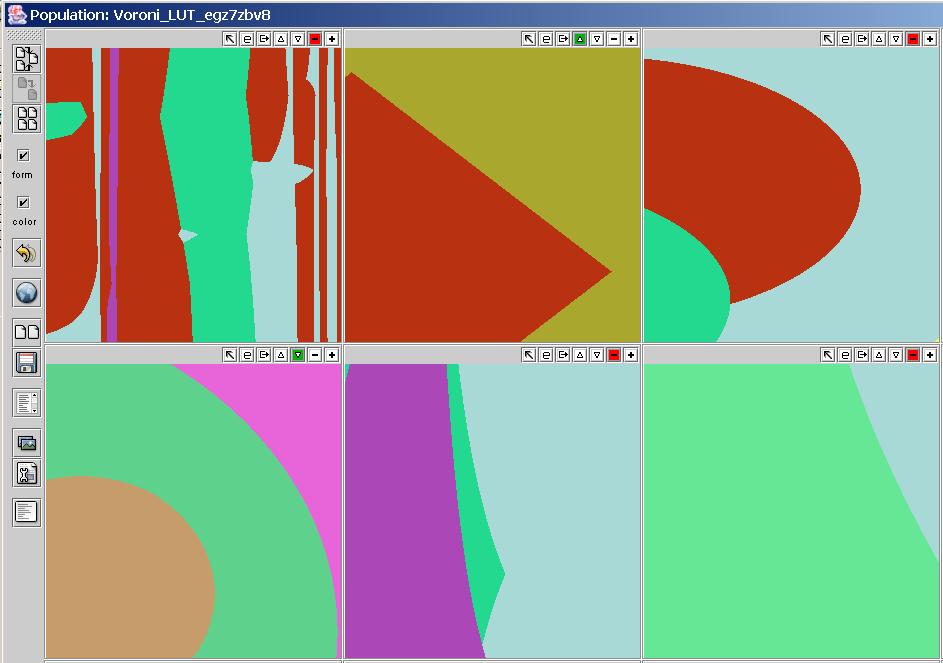
Many computer programs have been produced in this aim, among which are Genetic Art 4, that you can find as an applet here (8), and Kandid, that you can download here (6). Although Genetic Art 4 is easier to run (it is a simple web applet), Kandid is way more complete and offers several different ways to generate visually appealing computer images. Some of them are actual fractals, but it also has some other ways to generate images. One of those ways is through the use of Voronoi Diagrams. Since we saw in Section 4.1 that Voronoi Diagrams can be used to model natural phenomenons, they can also be used to produce images that are quite attractive. On Figure 10, we can see a screen shot of Kandid. The user sees a collection of computer generated images, and chose among two of them to produce new images that have some visual properties of their parents.
The last application of Voronoi Diagrams we discuss is on wireless security. In (3), the authors show how to use Voronoi Diagrams to perform rogue base station detection. First of all, a base station can be seen as a service access point for wireless mobile users. A rogue base station is an intruder which tries to fool a mobile user by stealing some base station identity. The rogue base station detection problem is, for a mobile user, to be able to determine wether or not the base station to which it is going to connect is actually a real or a rogue base station.
As mobile users are moving around, they are connected to the base
station which is the nearest. If ![]() is the Voronoi region of
a base station
is the Voronoi region of
a base station ![]() (with respect to the Voronoi Diagram generated
by all the base stations), a mobile user
(with respect to the Voronoi Diagram generated
by all the base stations), a mobile user ![]() is then always
connected to the unique base station
is then always
connected to the unique base station ![]() which region
which region ![]() contains the location of
contains the location of ![]() .
.
A mobile station can determine which base station is the nearest based on the received signal strength. The nearer a base station is, the stronger is the signal. Thus, when comes the time to chose to which base station to connect to, a mobile user just makes its decision by measuring the signal strength.
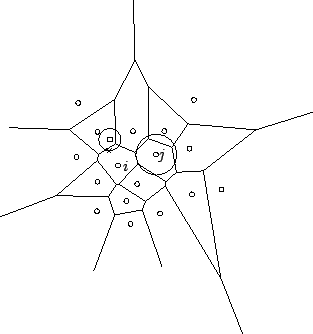
In Figure 11, user ![]() is connected to the
base station
is connected to the
base station ![]() but is now nearer to
but is now nearer to ![]() than to
than to ![]() .
Suppose now that
.
Suppose now that ![]() is a rogue base station which tries to
steal
is a rogue base station which tries to
steal ![]() 's identity. We show how
's identity. We show how ![]() can determine that
can determine that
![]() is not actually
is not actually ![]() . Since
. Since ![]() is connected to
is connected to ![]() ,
he knows that it is in
,
he knows that it is in ![]() . However, the received signal
strength is higher than what can be expected on the boundary of
. However, the received signal
strength is higher than what can be expected on the boundary of
![]() . This is because the smallest circle having center
. This is because the smallest circle having center ![]() and touching
and touching ![]() has radius smaller than the perceived
distance between
has radius smaller than the perceived
distance between ![]() and
and ![]() (which is actually the distance
between
(which is actually the distance
between ![]() and
and ![]() ). Since it is not possible that
this signal is so strong, then the mobile user
). Since it is not possible that
this signal is so strong, then the mobile user ![]() detects
that someone is trying to steal
detects
that someone is trying to steal ![]() 's identity and does not
connect to that station.
's identity and does not
connect to that station.
Since all the threshold distances can be pre-computed only once, this gives rise to an efficient algorithm (which is actually an heuristic) to detect rogue base stations.